Introduction
With the growth of a microservices architecture the ability to monitor and respond to the environment is paramount. Once you have more than a handful of K8s pods running, a more scalable approach is needed. This section covers details on:
• Prometheus components.
• Prometheus server for scraping and storing performance metrics
• Client libraries for instrumenting applications
• Alert Manager to create threshold rules and fire alerts to channels like email and Slack
• PromQL as the query language to form SELECTs and GROUPBYs on timeseries data
• Grafana components.
• Datasources for reading performance metrics
• Dashboards for displaying and analyzing performance metrics
• TimescaleDB components.
• Extensions to PostgresSQL for long-term data persistence
• API's for exposing time-oriented queries
Prometheus is not designed to be a long-term metrics store. All metrics recorded into Prometheus are first written to the local node, and then written to TimescaleDB. This means all metrics are immediately backed up so any failure on a Prometheus node will be less painful.
Container Network
Create a bridge network.
docker network create -d bridge prometheus_timescale_network
Inspect the network.
docker network inspect prometheus_timescale_network
Returns.
{
        "Name": "prometheus_timescale_network",
        "Id": "5a151e35057af8c8ffd779f44806e9033e62e663857a731948a73d3ab736fcef",
        "Created": "2019-07-13T15:34:18.87603738Z",
        "Scope": "local",
        "Driver": "bridge",
        "EnableIPv6": false,
        "IPAM": {
            "Driver": "default",
            "Options": {},
            "Config": [
                {
                    "Subnet": "172.18.0.0/16",
                    "Gateway": "172.18.0.1"
                }
            ]
        },
        "Internal": false,
        "Attachable": false,
        "Ingress": false,
        "ConfigFrom": {
            "Network": ""
        },
        "ConfigOnly": false,
        "Containers": {},
        "Options": {},
        "Labels": {}
    }
PostgreSQL and TimescaleDB Extension
Deploy the Postgres Pg_Prometheus and the TimescaleDB extension.
docker run -d --name timescaledb -p 5432:5432 \
-e POSTGRES_USER=postgres \
-e POSTGRES_PASSWORD=<Password_String> \
timescale/pg_prometheus \
-c synchronous_commit=off
Check the logs.
docker logs b1e32966add09ba166565d5b51aa8fbee43f366dc9d0694a04d893975f8e3cce
Returns:
WELCOME TO
 _____ _                               _     ____________
|_   _(_)                             | |    |  _  \ ___ \
  | |  _ _ __ ___   ___  ___  ___ __ _| | ___| | | | |_/ /
  | | | |  _ ` _ \ / _ \/ __|/ __/ _` | |/ _ \ | | | ___ \
  | | | | | | | | |  __/\__ \ (_| (_| | |  __/ |/ /| |_/ /
  |_| |_|_| |_| |_|\___||___/\___\__,_|_|\___|___/ \____/
               Running version 1.2.0
For more information on TimescaleDB, please visit the following links:

 1. Getting started: https://docs.timescale.com/getting-started
 2. API reference documentation: https://docs.timescale.com/api
 3. How TimescaleDB is designed: https://docs.timescale.com/introduction/architecture

Note: TimescaleDB collects anonymous reports to better understand and assist our users.
For more information and how to disable, please see our docs https://docs.timescaledb.com/using-timescaledb/telemetry.

CREATE EXTENSION
2019-07-13 15:40:04.374 UTC [46] ERROR:  TimescaleDB background worker connected to template database, exiting

/usr/local/bin/docker-entrypoint.sh: sourcing /docker-entrypoint-initdb.d/001_reenable_auth.sh
2019-07-13 15:40:04.374 UTC [30] LOG:  worker process: TimescaleDB Background Worker Scheduler (PID 46) exited with exit code 1

/usr/local/bin/docker-entrypoint.sh: sourcing /docker-entrypoint-initdb.d/002_timescaledb_tune.sh
Using postgresql.conf at this path:
/var/lib/postgresql/data/postgresql.conf

Writing backup to:
/tmp/timescaledb_tune.backup201907131540

Recommendations based on 6.79 GB of available memory and 2 CPUs for PostgreSQL 10
Saving changes to: /var/lib/postgresql/data/postgresql.conf
shared_buffers = 1739MB
effective_cache_size = 5217MB
maintenance_work_mem = 890385kB
work_mem = 44519kB
timescaledb.max_background_workers = 4
max_worker_processes = 9
max_parallel_workers_per_gather = 1
max_parallel_workers = 2
wal_buffers = 16MB
min_wal_size = 4GB
max_wal_size = 8GB
default_statistics_target = 500
random_page_cost = 1.1
checkpoint_completion_target = 0.9
max_connections = 20
max_locks_per_transaction = 64
effective_io_concurrency = 200
timescaledb.last_tuned = '2019-07-13T15:40:04Z'
timescaledb.last_tuned_version = '0.3.0'

.
.
.
PostgreSQL init process complete; ready for start up.

2019-07-13 15:40:05.027 UTC [1] LOG:  listening on IPv4 address "0.0.0.0", port 5432
2019-07-13 15:40:05.027 UTC [1] LOG:  listening on IPv6 address "::", port 5432
2019-07-13 15:40:05.054 UTC [1] LOG:  listening on Unix socket "/var/run/postgresql/.s.PGSQL.5432"
2019-07-13 15:40:05.129 UTC [55] LOG:  database system was shut down at 2019-07-13 15:40:04 UTC
2019-07-13 15:40:05.161 UTC [1] LOG:  database system is ready to accept connections
2019-07-13 15:40:05.163 UTC [61] LOG:  TimescaleDB background worker launcher connected to shared catalogs
Open port 9201.
az vm open-port --priority 1139 --resource-group Py4SAS --name Spark-node-vm --port 9201
Deploy the Prometheus PostgreSQL adapter.
docker run --network prometheus_timescale_network --name prometheus_postgresql_adapter -d -p 9201:9201 \
timescale/prometheus-postgresql-adapter:master \
-pg.password=XXXXXXXXXX \
-pg.host=Py4SAS-vm \
-pg.prometheus-log-samples
Check the logs.
docker logs 45ef30828b42d7c2fb7a3742b57a6af2d154ec252587fd2fec5f1935b0f0e2a1
Returns.
level=info ts=2019-07-13T15:48:49.615288015Z caller=client.go:80 msg="host=Py4SAS-vm port=5432 user=postgres dbname=postgres password='XXXXXXXXXXX' sslmode=disable connect_timeout=10"
level=info ts=2019-07-13T15:48:49.831775128Z caller=client.go:146 storage=PostgreSQL msg="Initialized pg_prometheus extension"
level=info ts=2019-07-13T15:48:49.831815928Z caller=main.go:96 msg="Starting up..."
level=info ts=2019-07-13T15:48:49.831834028Z caller=main.go:240 msg=Listening addr=:9201
Node Exporter
Deploy the node exporter to collect metrics on host (vm) performance.
docker run --network prometheus_timescale_network --name node_exporter -p 9100:9100 quay.io/prometheus/node-exporter
Returns.
time="2019-07-13T15:56:44Z" level=info msg="Starting node_exporter (version=0.18.1, branch=HEAD, revision=3db77732e925c08f675d7404a8c46466b2ece83e)" source="node_exporter.go:156"
time="2019-07-13T15:56:44Z" level=info msg="Build context (go=go1.12.5, user=root@b50852a1acba, date=20190604-16:41:18)" source="node_exporter.go:157"
time="2019-07-13T15:56:44Z" level=info msg="Enabled collectors:" source="node_exporter.go:97"
time="2019-07-13T15:56:44Z" level=info msg=" - arp" source="node_exporter.go:104"
time="2019-07-13T15:56:44Z" level=info msg=" - bcache" source="node_exporter.go:104"
time="2019-07-13T15:56:44Z" level=info msg=" - bonding" source="node_exporter.go:104"
time="2019-07-13T15:56:44Z" level=info msg=" - conntrack" source="node_exporter.go:104"
time="2019-07-13T15:56:44Z" level=info msg=" - cpu" source="node_exporter.go:104"
time="2019-07-13T15:56:44Z" level=info msg=" - cpufreq" source="node_exporter.go:104"
time="2019-07-13T15:56:44Z" level=info msg=" - diskstats" source="node_exporter.go:104"
time="2019-07-13T15:56:44Z" level=info msg=" - edac" source="node_exporter.go:104"
time="2019-07-13T15:56:44Z" level=info msg=" - entropy" source="node_exporter.go:104"
time="2019-07-13T15:56:44Z" level=info msg=" - filefd" source="node_exporter.go:104"
time="2019-07-13T15:56:44Z" level=info msg=" - filesystem" source="node_exporter.go:104"
time="2019-07-13T15:56:44Z" level=info msg=" - hwmon" source="node_exporter.go:104"
time="2019-07-13T15:56:44Z" level=info msg=" - infiniband" source="node_exporter.go:104"
time="2019-07-13T15:56:44Z" level=info msg=" - ipvs" source="node_exporter.go:104"
time="2019-07-13T15:56:44Z" level=info msg=" - loadavg" source="node_exporter.go:104"
time="2019-07-13T15:56:44Z" level=info msg=" - mdadm" source="node_exporter.go:104"
time="2019-07-13T15:56:44Z" level=info msg=" - meminfo" source="node_exporter.go:104"
time="2019-07-13T15:56:44Z" level=info msg=" - netclass" source="node_exporter.go:104"
time="2019-07-13T15:56:44Z" level=info msg=" - netdev" source="node_exporter.go:104"
time="2019-07-13T15:56:44Z" level=info msg=" - netstat" source="node_exporter.go:104"
time="2019-07-13T15:56:44Z" level=info msg=" - nfs" source="node_exporter.go:104"
time="2019-07-13T15:56:44Z" level=info msg=" - nfsd" source="node_exporter.go:104"
time="2019-07-13T15:56:44Z" level=info msg=" - pressure" source="node_exporter.go:104"
time="2019-07-13T15:56:44Z" level=info msg=" - sockstat" source="node_exporter.go:104"
time="2019-07-13T15:56:44Z" level=info msg=" - stat" source="node_exporter.go:104"
time="2019-07-13T15:56:44Z" level=info msg=" - textfile" source="node_exporter.go:104"
time="2019-07-13T15:56:44Z" level=info msg=" - time" source="node_exporter.go:104"
time="2019-07-13T15:56:44Z" level=info msg=" - timex" source="node_exporter.go:104"
time="2019-07-13T15:56:44Z" level=info msg=" - uname" source="node_exporter.go:104"
time="2019-07-13T15:56:44Z" level=info msg=" - vmstat" source="node_exporter.go:104"
time="2019-07-13T15:56:44Z" level=info msg=" - xfs" source="node_exporter.go:104"
time="2019-07-13T15:56:44Z" level=info msg=" - zfs" source="node_exporter.go:104"
time="2019-07-13T15:56:44Z" level=info msg="Listening on :9100" source="node_exporter.go:170"
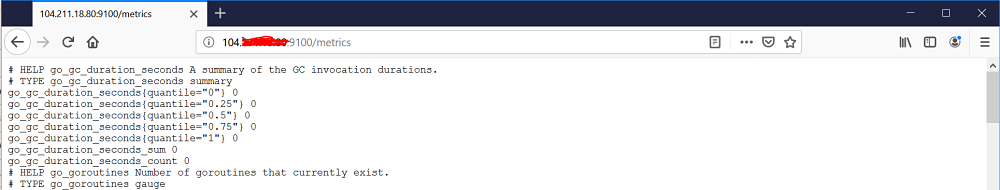
Verify that system metrics are being exported by visiting http://localhost:9100/metrics. Prometheus will scrape /metrics endpoint to get metrics.
Prometheus
Deploy Prometheus by creating the prometheus.yml config file is pointing to the Node Exporter instance created above.
Create the mm directory and change directory.
mkdir ~/mm && cd ~/mm
Edit /etc/promethueus/prometheus.yml file adding:
global:
 scrape_interval:     10s
 evaluation_interval: 10s
scrape_configs:
 - job_name: prometheus
   static_configs:
     - targets: ['node_exporter:9100']
remote_write:
 - url: "http://Py4SAS-vm:9201/write"
remote_read:
 - url: "http://PyforSAS-vm:9201/read"
Deploy Prometheus.
docker run --network prometheus_timescale_network -p 9090:9090 \
-v /etc/prometheus/prometheus.yml:/etc/prometheus/prometheus.yml \
prom/prometheus
Returns.
level=info ts=2019-07-13T16:16:46.524Z caller=main.go:293 msg="no time or size retention was set so using the default time retention" duration=15d
level=info ts=2019-07-13T16:16:46.524Z caller=main.go:329 msg="Starting Prometheus" version="(version=2.11.0, branch=HEAD, revision=4ef66003d9855ed2b7a41e987b33828ec36db34d)"
level=info ts=2019-07-13T16:16:46.524Z caller=main.go:330 build_context="(go=go1.12.7, user=root@0dc27cf95f36, date=20190709-09:54:35)"
level=info ts=2019-07-13T16:16:46.524Z caller=main.go:331 host_details="(Linux 3.10.0-957.21.3.el7.x86_64 #1 SMP Tue Jun 18 16:35:19 UTC 2019 x86_64 6c05d6d4038c (none))"
level=info ts=2019-07-13T16:16:46.524Z caller=main.go:332 fd_limits="(soft=1048576, hard=1048576)"
level=info ts=2019-07-13T16:16:46.524Z caller=main.go:333 vm_limits="(soft=unlimited, hard=unlimited)"
level=info ts=2019-07-13T16:16:46.526Z caller=main.go:652 msg="Starting TSDB ..."
level=info ts=2019-07-13T16:16:46.527Z caller=web.go:448 component=web msg="Start listening for connections" address=0.0.0.0:9090
level=info ts=2019-07-13T16:16:46.534Z caller=main.go:667 fs_type=XFS_SUPER_MAGIC
level=info ts=2019-07-13T16:16:46.534Z caller=main.go:668 msg="TSDB started"
level=info ts=2019-07-13T16:16:46.534Z caller=main.go:738 msg="Loading configuration file" filename=/etc/prometheus/prometheus.yml
level=info ts=2019-07-13T16:16:46.535Z caller=wal_watcher.go:149 component=remote queue=0:http://Py4SAS-vm:9201/write msg="starting WAL watcher" queue=0:http://Py4SAS-vm:9201/write
level=info ts=2019-07-13T16:16:46.537Z caller=main.go:766 msg="Completed loading of configuration file" filename=/etc/prometheus/prometheus.yml
level=info ts=2019-07-13T16:16:46.537Z caller=main.go:621 msg="Server is ready to receive web requests."
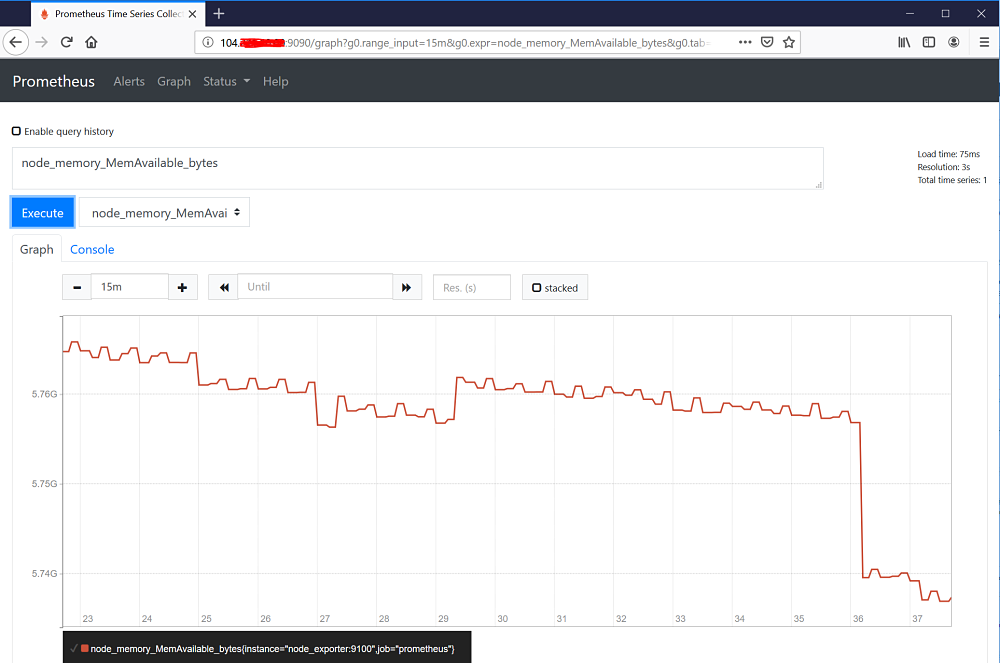
Test the ability to query the collected metrics by pointing a browser to http://localhost:9090/graph. In the example below node memory available is graphed.
Query the TimescaleDB directly.
docker exec -it timescaledb bash
psql postgres postgres
Enter the query:
SELECT time_bucket('5 minutes', time) AS five_min_bucket, name, avg(value)
FROM metrics
WHERE (name='node_load5' OR name='node_memory_Active_bytes') AND
      time > NOW() - interval '1 day'
GROUP BY five_min_bucket,name
ORDER BY five_min_bucket;
Returns.
    five_min_bucket     |           name           |        avg
------------------------+--------------------------+-------------------
 2019-07-13 16:15:00+00 | node_load5               |  1.84263157894737
 2019-07-13 16:15:00+00 | node_memory_Active_bytes |  1055776552.42105
 2019-07-13 16:20:00+00 | node_load5               |  1.62533333333333
 2019-07-13 16:20:00+00 | node_memory_Active_bytes |      1070225817.6
 2019-07-13 16:25:00+00 | node_load5               |  1.06166666666667
 2019-07-13 16:25:00+00 | node_memory_Active_bytes |  1084650018.13333
 2019-07-13 16:30:00+00 | node_load5               | 0.593333333333333
 2019-07-13 16:30:00+00 | node_memory_Active_bytes |  1093145668.26667
 2019-07-13 16:35:00+00 | node_load5               | 0.322333333333333
 2019-07-13 16:35:00+00 | node_memory_Active_bytes |  1108816145.06667
 2019-07-13 16:40:00+00 | node_load5               | 0.180666666666667
 2019-07-13 16:40:00+00 | node_memory_Active_bytes |      1125213388.8
 2019-07-13 16:45:00+00 | node_load5               |             0.126
 2019-07-13 16:45:00+00 | node_memory_Active_bytes |  1134488098.13333
 2019-07-13 16:50:00+00 | node_load5               | 0.133333333333333
 2019-07-13 16:50:00+00 | node_memory_Active_bytes |        1162440704
(16 rows)
The time_bucket function as a part of the SELECT statement is a feature unique to the TimescaleDB function to Postgres.
Grafana
Pull the latest grafana image.
docker pull grafana/grafana
Returns.
Using default tag: latest
latest: Pulling from grafana/grafana
fc7181108d40: Pull complete
b3698e2f9d08: Pull complete
13ca9094bc72: Pull complete
8412253947ed: Pull complete
8efa19c8dbaf: Pull complete
afa031bd3fdb: Pull complete
Digest: sha256:a48dbcdd80f74465d98dbea58911fc450bc76cf2c89a5046b0551f7d260fe88a
Status: Downloaded newer image for grafana/grafana:latest
Run the docker image and deploy the Kubernetes plug-in. The Postgres and Prometheus plug-ins come already configured.
docker run --network prometheus_timescale_network \
-d -p 3000:3000 \
--name=grafana \
-e "GF_INSTALL_PLUGINS=grafana-kubernetes-app" \
-e "GF_PATHS_LOGS=/var/log/grafana" \
-e "GF_PATHS_DATA=/var/lib/grafana" \
grafana/grafana:latest
Check the logs.
docker logs 41cb724ac1ba16a7ee3ecea7bece92ec0d2cc0febffae32e7526020cf586f56a
Returns.
Usage of grafana-server:
  -config string
        path to config file
  -convey-json
        When true, emits results in JSON blocks. Default: 'false'
  -convey-silent
        When true, all output from GoConvey is suppressed.
  -convey-story
        When true, emits story output, otherwise emits dot output. When not provided, this flag mirrors the value of the '-test.v' flag
  -homepath string
        path to grafana install/home path, defaults to working directory
  -packaging string
        describes the way Grafana was installed (default "unknown")
  -pidfile string
        path to pid file
  -profile
        Turn on pprof profiling
  -profile-port int
        Define custom port for profiling (default 6060)
  -test.bench regexp
        run only benchmarks matching regexp
  -test.benchmem
        print memory allocations for benchmarks
  -test.benchtime d
        run each benchmark for duration d (default 1s)
  -test.blockprofile file
        write a goroutine blocking profile to file
  -test.blockprofilerate rate
        set blocking profile rate (see runtime.SetBlockProfileRate) (default 1)
  -test.count n
        run tests and benchmarks n times (default 1)
  -test.coverprofile file
        write a coverage profile to file
  -test.cpu list
        comma-separated list of cpu counts to run each test with
  -test.cpuprofile file
        write a cpu profile to file
  -test.failfast
        do not start new tests after the first test failure
  -test.list regexp
        list tests, examples, and benchmarks matching regexp then exit
  -test.memprofile file
        write an allocation profile to file
  -test.memprofilerate rate
        set memory allocation profiling rate (see runtime.MemProfileRate)
  -test.mutexprofile string
        write a mutex contention profile to the named file after execution
  -test.mutexprofilefraction int
        if >= 0, calls runtime.SetMutexProfileFraction() (default 1)
  -test.outputdir dir
        write profiles to dir
  -test.parallel n
        run at most n tests in parallel (default 2)
  -test.run regexp
        run only tests and examples matching regexp
  -test.short
        run smaller test suite to save time
  -test.testlogfile file
        write test action log to file (for use only by cmd/go)
  -test.timeout d
        panic test binary after duration d (default 0, timeout disabled)
  -test.trace file
        write an execution trace to file
  -test.v
        verbose: print additional output
  -v    prints current version and exits
Add restricted user grafanareader to Postgres.
docker exec -it timescaledb /bin/bash
Log into the Postgres database.
psql postgres postgres
Execute.
CREATE USER grafanareader WITH PASSWORD '<Password_String>'; GRANT SELECT ON ALL TABLES IN SCHEMA public TO grafanareader; GRANT EXECUTE ON ALL FUNCTIONS IN SCHEMA public TO grafanareader;
Returns.
CREATE ROLE
GRANT
GRANT
Open port 3000.
az vm open-port --priority 1213 --resource-group Py4SAS --name Spark-node-vm --port 3000
Point a browser to http://localhost/3000.
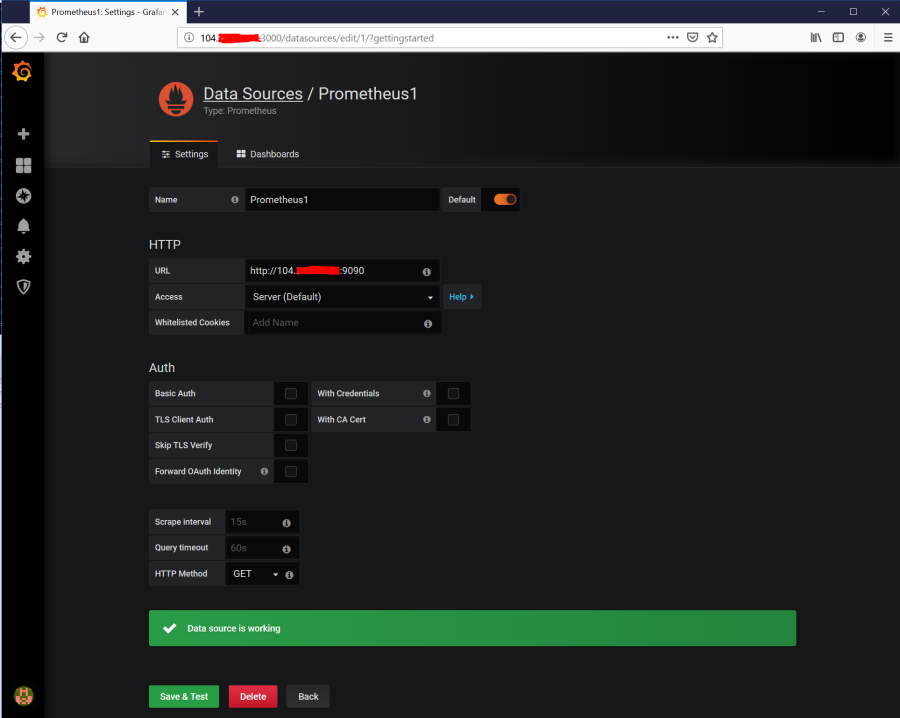
Point grafana to the Prometheus server listening on port 9090.
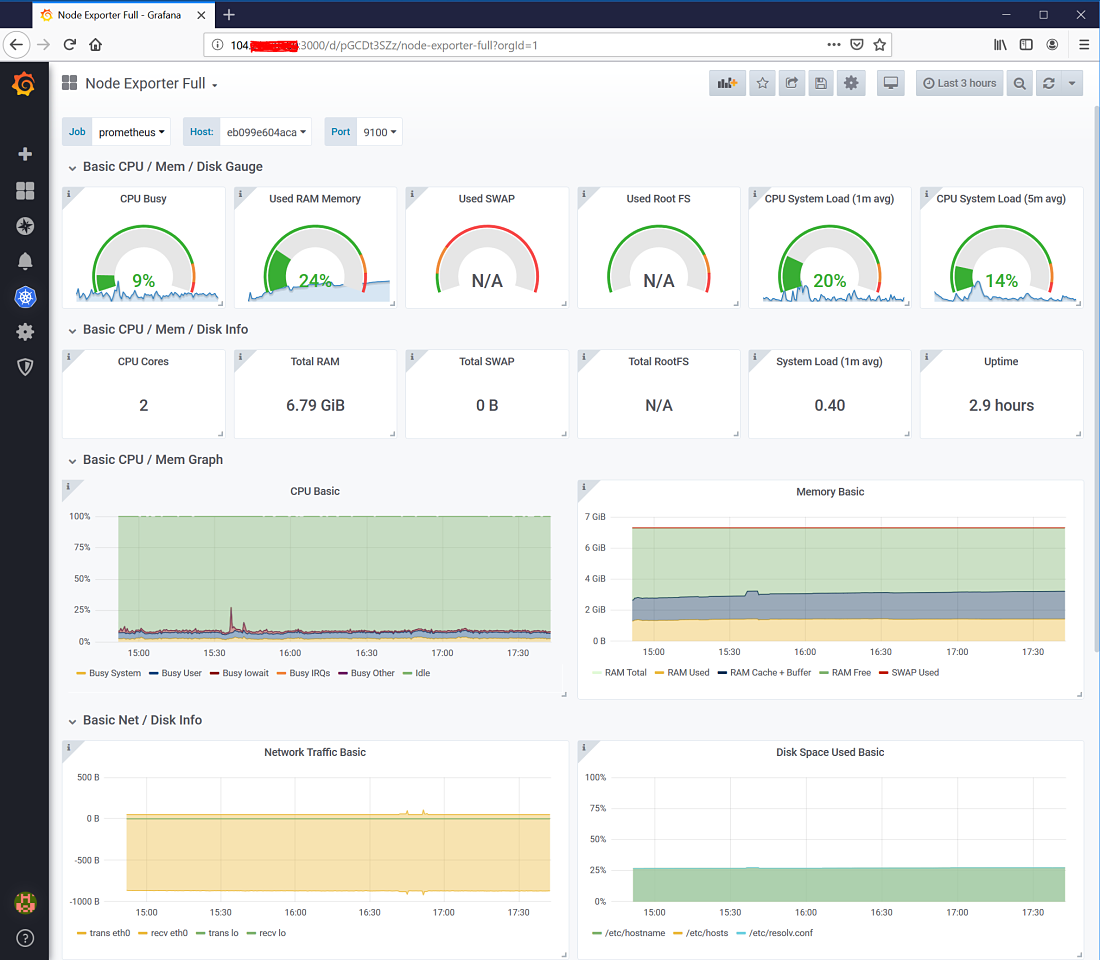
Grafana dashboard rendering Node Exporter metrics.